NYC Recycling Over Time
Metal, Glass, Plastic, and Organics collected monthly by the NYC Dept. of Sanitation
Hint: Mouse over the bars.
Inspiring everyone to recycle a little better
Hint: Mouse over the bars.
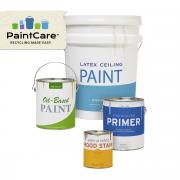 Got Unwanted or Leftover Paint?
Find a PaintCare drop-off site and recycle your leftover paint products.
Accepted products include latex paint, oil-based paint, stain, varnish, and more.
View the list of accepted products and find a drop-off location near you.
Visit PaintCare.org or call (855) PAINT09.
Hint: Mouse over the bars.